


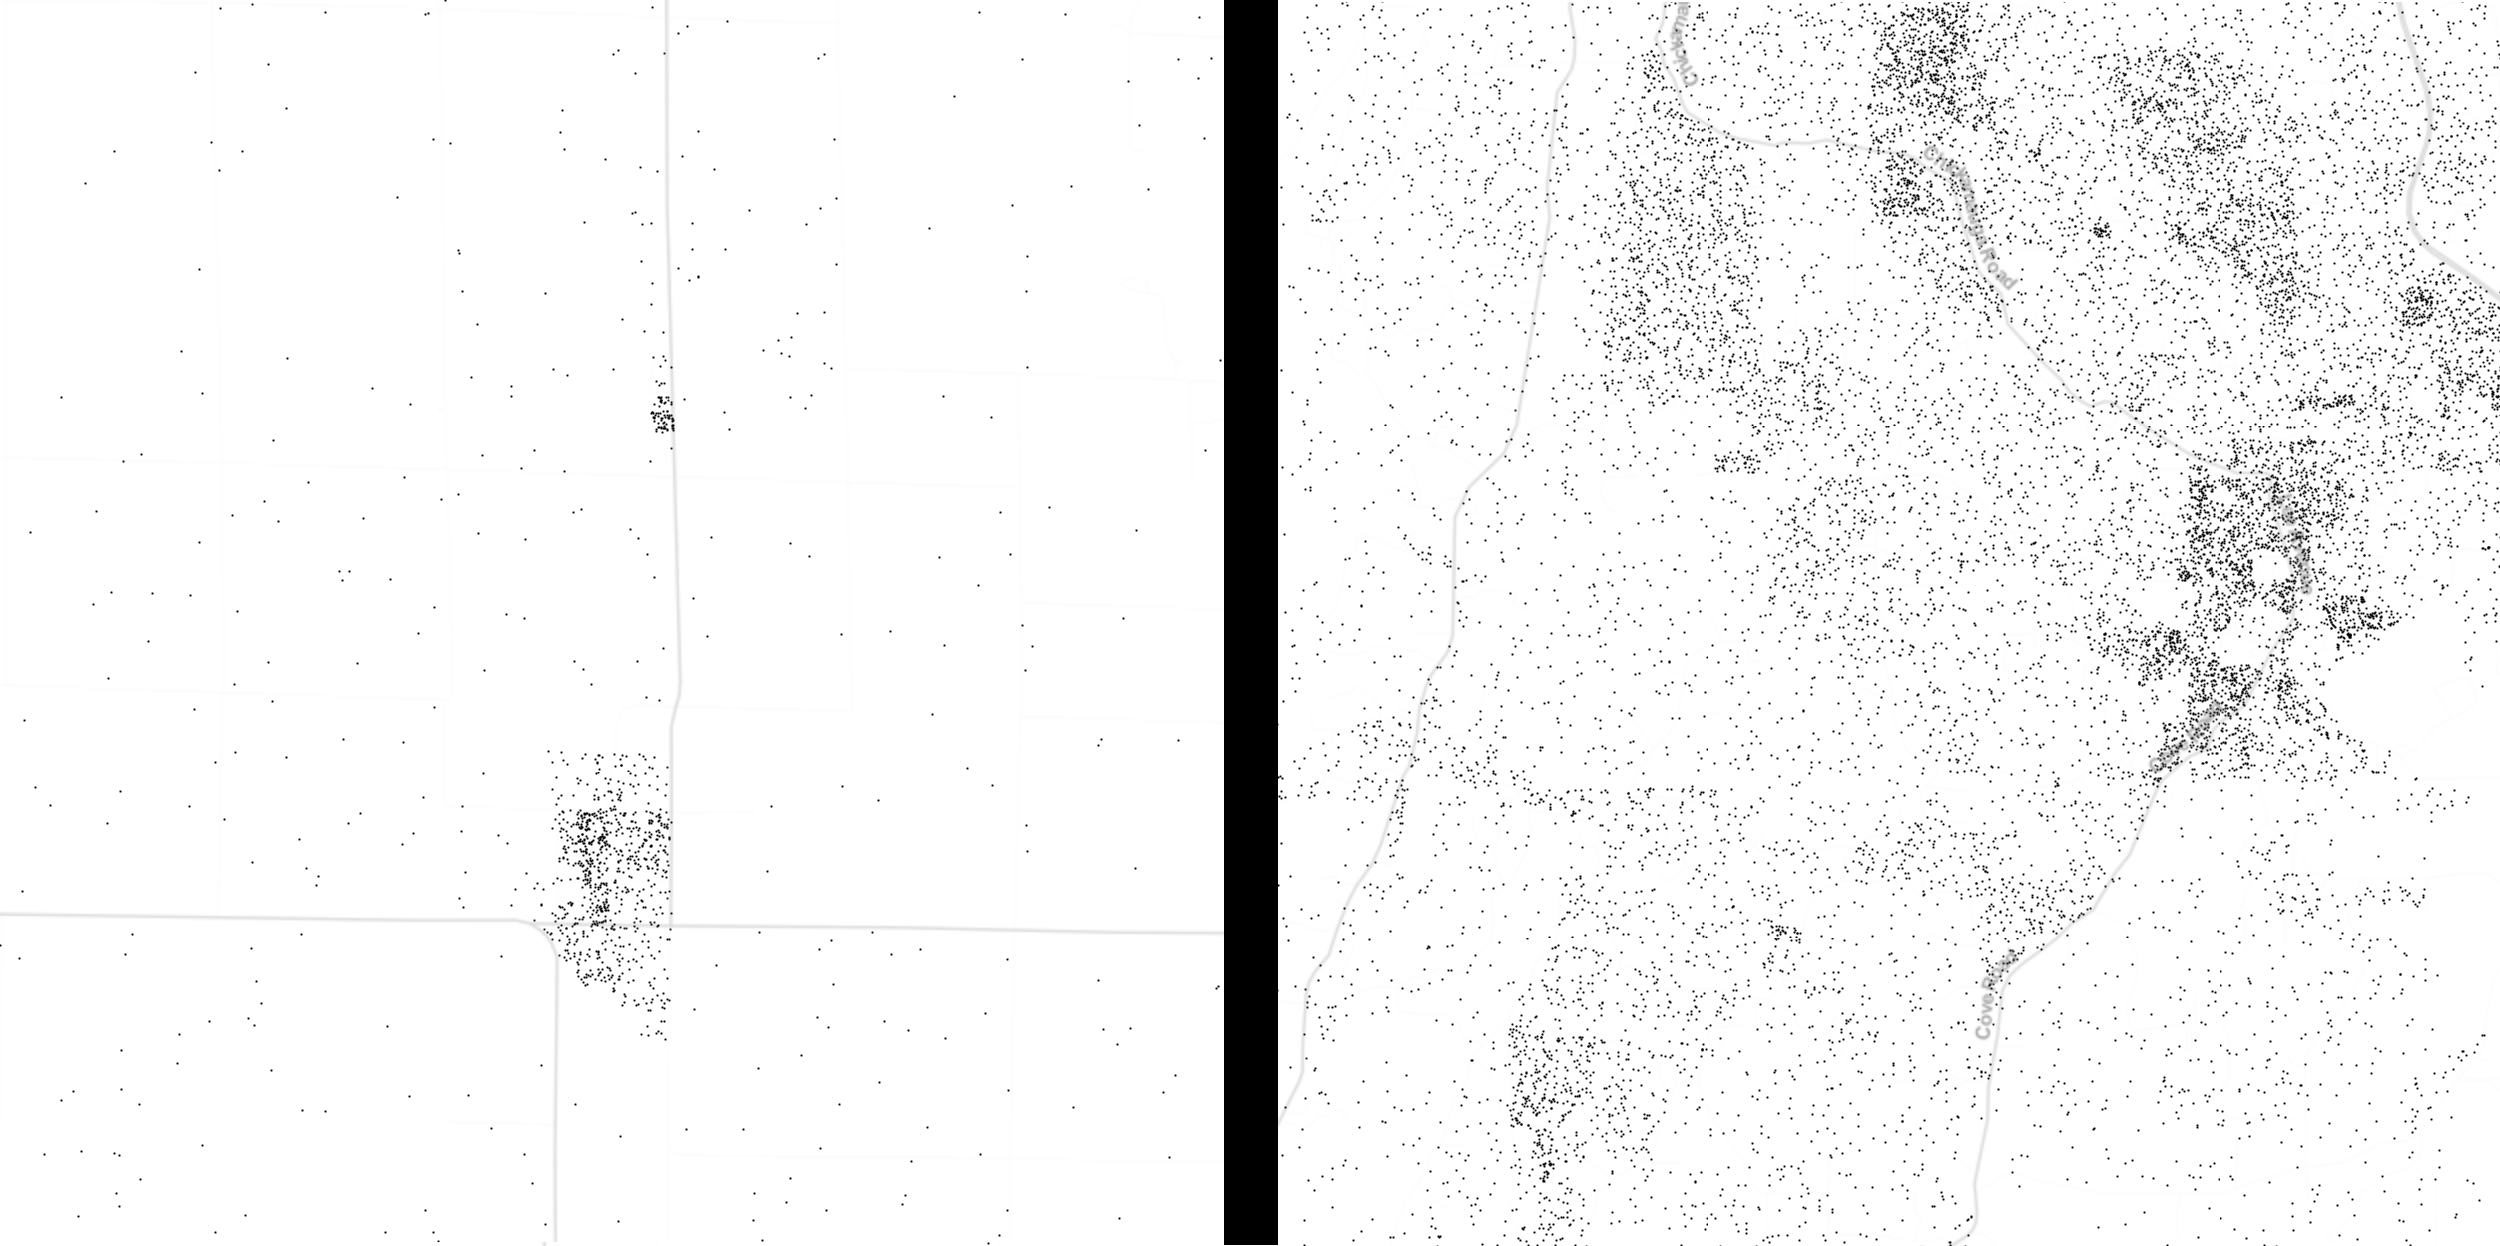
The two images above are from the Racial Dot Map, created from 2010 Census data at the University of Virginia. The image on the left is Walker, Iowa, with a little cluster to the north of it that represents the boarding school where I grew up. The image on the right is Chickamauga, Ga. The images are zoomed to the same scale. Each dot represents a person (I turned off the racial color-coding to make these screenshots).
I find the contrast in rural population density interesting. Where I live in Georgia, the countryside is full of homes and people. Obviously that’s not the case where I grew up in Iowa. Land quality is a big factor, of course. There are probably other factors I’m not thinking of.
The Racial Dot Map is a wonderful resource, and not just for figuring out where people of various races and ethnicities live. As far as I can tell, UVA is looking for funding to recreate it based on 2020 Census data. They don’t have the funding yet.
——
A good interrogation of Trumpist “patriotism” — The Bulwark
Global high temps are a problem for the military — RS
FBI helped ruler of Dubai recapture his fleeing daughter — USAT
White mainline Protestants outnumber white Evangelicals — RNS
Trump made major gains with Latino voters in 2020 — Pew*
MLK: A gospel of solidarity, not “colorblindness” — Yglesias
A college English teacher’s basically hopeless story — Quillette
Interesting thread on problems in rural China — T. Greer
*there’s plenty of other stuff from that survey but the Latino swing to Trump (from 28% in 2016 to 38% in 2020) is the most interesting and surprising.
Quote
“I found Rome a city of bricks and left it a city of marble.” — Caesar Augustus
About: I send this email most weekdays in an effort to stay informed and in touch. I was a newspaper reporter for 14 years, most recently at the Minneapolis Star Tribune. I explained why my family left Minneapolis here. Now we live just outside Chattanooga and I work on Scuffed News. Please share this newsletter with anyone you think might enjoy it. And please consider supporting this work with your money on Patreon.
Rural population density is really interesting. I've worked out at Cono (Ridge Haven) for several summers and one winter now, and as a lifelong southerner the difference in rural settlement always seemed really interesting to me. I always attributed it to topography and differences in political economy. Thanks for sharing the Racial Dot Map!